The Ag Budget Operations Table presents a detailed compilation of operations along with their corresponding parameters and material inputs for both conventional and energy crops used in the Billion Ton 2023 study. This dataset encompasses a range of activities, including land preparation, planting, fertilization, pest management, land maintenance, and harvesting.
Key fields within the dataset include equipment data, fertilizer and chemical application details, and seed information. Additionally, the dataset contains cost metrics such as purchase costs and labor costs, enabling users to effectively analyze the financial aspects of crop production.
To enhance understanding of the data, a supplementary spreadsheet is provided, containing field definitions that clarify the terminology and metrics used throughout the dataset.
Supporting Data
Yield (i.e., tons of biomass per acre per year) is a key driver of production potential for many biomass resources. For agricultural resources, crop- and county-specific yields are an input to the economic modeling used to assess biomass production capacity in the BT23. Yields for agricultural biomass resources were derived from field trials from the Sun Grant Initiative Regional Feedstock Partnership, which served the basis for calibration of county yields (see 2016 Billion-Ton Report section 4.2.4)
For the 2016 and 2023 Billion-Ton reports, a workflow was established to provide a series of yields including biophysical, harvestable potential, future year- and scenario-specific potential, stand-age specific potential, and final solution yields. These datasets are comprised of several yield types including 1) PRISM Yield, 2) Base Harvestable Mean Annual Increment, 3) Mature Harvestable Yield (or MAI) by scenario, 4) Harvestable Yield for the Complete Crop Rotation by Scenario, and 5) Solution Yield by Scenario. Each yield type is defined below in the metadata.
This write up summarizes the potential for biobased adhesives to be sourced from various material, specifically focusing on the following relevant factors:
1. Current biomass availability,
2. Market costs
3. Locations of industry/supply
4. Projections on how these materials will increase in availability according to their expected increased uses.
This project contributes to understanding and enhancing socioeconomic and environmental benefits of biofuels through modeling the effect of prices and policy incentives on fuel markets for “hard-to-decarbonize” transportation sectors. The main analytical tool used in this project is the BioTrans model, originally developed to assess and quantify the economic and energy security benefits of biofuels for light-duty vehicles and bioproducts. This project restructured and updated the BioTrans model to assess biofuels for the hard-to-decarbonize transportation sectors such as the aviation and shipping.
The BioTrans model is a market equilibrium model assessing the biofuel supply chain for a 30-year horizon with annual periods. It is a national (United States) model and has states as its spatial units. The model maximizes social surplus, which implies minimizing the costs, while meeting transportation fuel demands. While it takes transportation fuel markets into account endogenously, land allocation decisions and non-biofuel uses of biomass are considered exogenously. The model considers potential synergies or competition for the use of biomass among the different transportation segments as well as the competition between new biofuels and incumbent petroleum-based fuels.
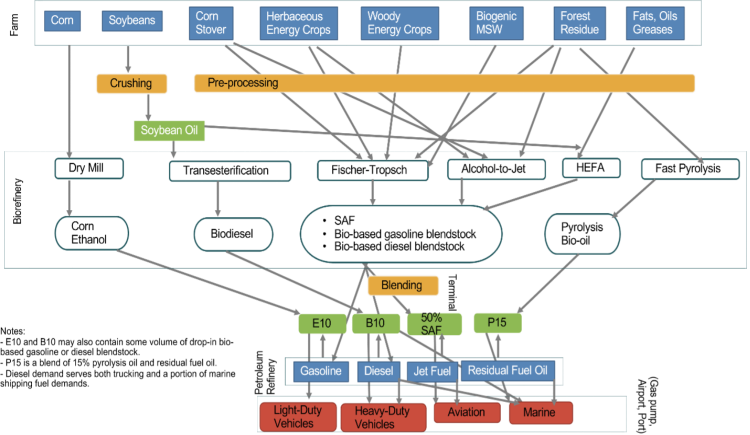
The diagram in Figure 1 summarizes the main components included in BioTrans as of June 2024.
The biomass feedstocks and petroleum products in blue rectangles are those for which the model includes supply curves, and the transportation segments in red boxes are those for which the model includes demand curves. The intermediate activities reflect the steps required to convert biomass into biofuel, and the intermediate products are biofuels required for blending and retail. Each commodity must satisfy a material balance equation so that its sources and sinks match with each other.
The ability to explore the interaction of federal and state-level biofuel policies and their impact on the volume and mix of biofuels produced in the United States is one of the key attributes of the model. As of June 2024, BioTrans contains representations of the following biofuel-related policies and incentives:
Federal
- Renewable Fuel Standard
- Inflation Reduction Act (IRA) tax credits (Section 13201, Section 13202, Section 13203, Section 13704)
State
- California Low Carbon Fuel Standard
- Oregon Clean Fuel Program
- SAF tax credits
- Biodiesel and biomass-based diesel blending mandates
The code for the BioTrans model is available at https://code.ornl.gov/bioenergy/biotrans_model
This International Feedstocks data portal supports the Global Biomass Resource Assessment, a multi-country government-led initiative dedicated to advancing the global transition to a bioeconomy. This product shares data assembled from citable sources around the globe, as reported for current biomass production as well as potential additional future production in some cases. Data were compiled into consistent classes based on the most recent reports received (ranging from 2018 to 2024).
The results from this new global sustainable supply assessment will allow scientists, policymakers, and industry leaders to explore potential sources of biomass as a foundation for a global bioeconomy, supporting fuels, chemicals, materials and other products. The assessment was conducted by researchers at the U.S. Department of Energy(DOE) Oak Ridge National Laboratory (ORNL), with funding provided by the U.S. Department of State, and managed through DOE’s Bioenergy Technologies Office (BETO), on behalf of the CEM Biofuture Initiative and Mission Innovation. This data includes biomass resources available in many developing economies which often do not have fully advanced biomass industries. The assessment also aims to address the need for internationally accepted benchmarks quantifying sustainable biomass feedstock supplies that can be available to support a growing bioeconomy.
Download the Mapping and Synthesis of International Biomass Supply Assessments (pdf, January 2025) document for more information.

The link below provides access to the data which can be filtered by country of interest and resource, as well as timeframe for the available biomass. The data are being shared based on the information received to date (references to sources are noted for each reported nation). We aim to improve and update this preliminary version of the data set in the future, based on user feedback. Please send suggestions for improvement and references to additional sources of data, or corrections to the reported data. Data comments can be sent to biomass.updates@ornl.gov
International Feedstocks Data View
This data can be filtered by country and downloaded for further analysis. For example, the country of Uruguay is summarized below for available resources by year of production.

This dataset contains data on forest production. The forestry products in this dataset includes hardwood, softwood, and mixed, and the dataset was obtained from the database of the 2023 Billion-Ton Report (Davis et al., 2024). The intended use is for the Feedstock Production Emissions to Air Model (FPEAM).
If you would also like access to this dataset, please use the "contact" button for a request to our research staff.
This dataset contains data on agricultural crop production. The agricultural crop in this dataset includes barley, corn, cotton, grain sorghum, hay, oats, rice, soybeans, and wheat, and the dataset was obtained from the database of the 2023 Billion-Ton Report (Davis et al., 2024) for the Feedstock Production Emissions to Air Model (FPEAM).
For access to this dataset, please use the contact form and indicate the dataset by name.
This dataset provides additional variables for modelers and other interested stakeholders for yield assumptions for modeled energy crops on agricultural land in the CONUS, as modeled by the POLYSYS model.
The yield unit was changed from lb/ac to dt/ac post-processing.
V0.1 changes include: tillage for subclass like 'energy crop' is now '[null]' and for subclass = 'Intermediate oilseeds' 'till' is now 'CT' (Conventional Tillage), format now uses pipe (|) delimiter.
This dataset can be cited as:
Hellwinckel, C., D. de la Torre Ugarte, H. Cook, M Davis, M. Langholtz. 2024. “A Customized Dataset for Yield from Agricultural Resources Modeled with POLYSYS as highlighted in Chapter 5: Biomass from Agriculture.” In 2023 Billion‐Ton Report. M. H. Langholtz (Lead). Oak Ridge, TN: Oak Ridge National Laboratory. doi: 10.23720/BT2023/2350581.
The chapter relevant to this research can be cited as:
Hellwinckel, C., D. de la Torre Ugarte, J. L. Field, and M. Langholtz. 2024. “Chapter 5: Biomass from Agriculture.” In 2023 Billion‐Ton Report. M. H. Langholtz (Lead). Oak Ridge, TN: Oak Ridge National Laboratory. doi: 10.23720/BT2023/2316171.
This dataset includes waster resources prepared for BT23 Chapter 3. Please access the data through the BT23 Data Portal or directly at https://bioenergykdf.ornl.gov/bt23-wastes-download
Please cite as:
Milbrandt, A., and A. Badgett. 2024, Data from Biomass from waste streams, of Chapter 3 in the 2023 Billion-Ton Report. Version 0.0.1, Bioenergy Knowledge Discovery Framework (bioenergyKDF)Data Center, https://doi.org/10.23720/BT2023/2282886
This dataset includes ForSEAM and BioSUM model output prepared for BT23 Chapter 4, as well as USDA-FS Forest Inventory Analysis datasets used to calculate waste biomass from the forested land base. Please access the data through the BT23 Data Portal or directly at https://bioenergykdf.ornl.gov/bt23-forestry-download
Please cite as:
Davis, M., L. Lambert, R. Jacobson, C. Brandeis, J. Fried, B. English. 2024, Modeled Output and Other Data from Biomass from the Forested Land Base, of Chapter 4 in the 2023 Billion-Ton Report. Version 0.0.1, Bioenergy Knowledge Discovery Framework (KDF) Data Center, https://doi.org/10.23720/BT2023/2281324