This write up summarizes the potential for biobased adhesives to be sourced from various material, specifically focusing on the following relevant factors:
1. Current biomass availability,
2. Market costs
3. Locations of industry/supply
4. Projections on how these materials will increase in availability according to their expected increased uses.
DOE
This project contributes to understanding and enhancing socioeconomic and environmental benefits of biofuels through modeling the effect of prices and policy incentives on fuel markets for “hard-to-decarbonize” transportation sectors. The main analytical tool used in this project is the BioTrans model, originally developed to assess and quantify the economic and energy security benefits of biofuels for light-duty vehicles and bioproducts. This project restructured and updated the BioTrans model to assess biofuels for the hard-to-decarbonize transportation sectors such as the aviation and shipping.
The BioTrans model is a market equilibrium model assessing the biofuel supply chain for a 30-year horizon with annual periods. It is a national (United States) model and has states as its spatial units. The model maximizes social surplus, which implies minimizing the costs, while meeting transportation fuel demands. While it takes transportation fuel markets into account endogenously, land allocation decisions and non-biofuel uses of biomass are considered exogenously. The model considers potential synergies or competition for the use of biomass among the different transportation segments as well as the competition between new biofuels and incumbent petroleum-based fuels.
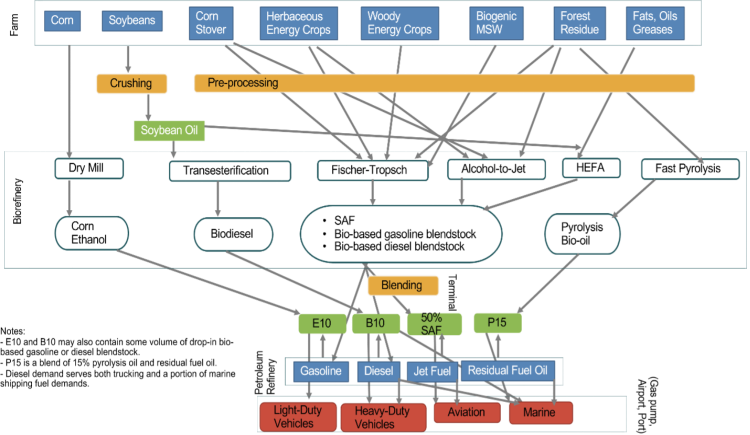
The diagram in Figure 1 summarizes the main components included in BioTrans as of June 2024.
The biomass feedstocks and petroleum products in blue rectangles are those for which the model includes supply curves, and the transportation segments in red boxes are those for which the model includes demand curves. The intermediate activities reflect the steps required to convert biomass into biofuel, and the intermediate products are biofuels required for blending and retail. Each commodity must satisfy a material balance equation so that its sources and sinks match with each other.
The ability to explore the interaction of federal and state-level biofuel policies and their impact on the volume and mix of biofuels produced in the United States is one of the key attributes of the model. As of June 2024, BioTrans contains representations of the following biofuel-related policies and incentives:
Federal
- Renewable Fuel Standard
- Inflation Reduction Act (IRA) tax credits (Section 13201, Section 13202, Section 13203, Section 13704)
State
- California Low Carbon Fuel Standard
- Oregon Clean Fuel Program
- SAF tax credits
- Biodiesel and biomass-based diesel blending mandates
The code for the BioTrans model is available at https://code.ornl.gov/bioenergy/biotrans_model
This International Feedstocks data portal supports the Global Biomass Resource Assessment, a multi-country government-led initiative dedicated to advancing the global transition to a sustainable bio-based economy. This product shares data assembled from citable sources around the globe, as reported for current biomass production as well as potential additional future production in some cases. Data were compiled into consistent classes based on the most recent reports received (ranging from 2018 to 2024).
The results from this new global sustainable supply assessment will allow scientists, policymakers, and industry leaders to explore potential sources of biomass as a foundation for a circular and sustainable global bioeconomy, supporting clean fuels, chemicals, materials and other products. The assessment was conducted by researchers at the U.S. Department of Energy (DOE) Oak Ridge National Laboratory (ORNL), with funding provided by the U.S. Department of State, and managed through DOE’s Bioenergy Technologies Office (BETO), on behalf of the CEM Biofuture Initiative and Mission Innovation. This data includes biomass resources available in many developing economies which often do not have fully advanced biomass industries. The assessment also aims to address the need for internationally accepted benchmarks quantifying sustainable biomass feedstock supplies that can be available to support a growing, circular and climate-smart bioeconomy.
The link below provides access to the data which can be filtered by country of interest and resource, as well as timeframe for the available biomass. The data are being shared based on the information received to date (references to sources are noted for each reported nation). We aim to improve and update this preliminary version of the data set in the future, based on user feedback. Please send suggestions for improvement and references to additional sources of data, or corrections to the reported data. [Data comments can be sent to biomass.updates@ornl.gov]
International Feedstocks Data View
This data can be filtered by country and downloaded for further analysis. For example, the country of Uruguay is summarized below for available resources by year of production.
This dataset contains data on forest production. The forestry products in this dataset includes hardwood, softwood, and mixed, and the dataset was obtained from the database of the 2023 Billion-Ton Report (Davis et al., 2024). The intended use is for the Feedstock Production Emissions to Air Model (FPEAM).
If you would also like access to this dataset, please use the "contact" button for a request to our research staff.
This dataset provides additional variables for modelers and other interested stakeholders for yield assumptions for modeled energy crops on agricultural land in the CONUS, as modeled by the POLYSYS model.
The yield unit was changed from lb/ac to dt/ac post-processing.
V0.1 changes include: tillage for subclass like 'energy crop' is now '[null]' and for subclass = 'Intermediate oilseeds' 'till' is now 'CT' (Conventional Tillage), format now uses pipe (|) delimiter.
This dataset can be cited as:
Hellwinckel, C., D. de la Torre Ugarte, H. Cook, M Davis, M. Langholtz. 2024. “A Customized Dataset for Yield from Agricultural Resources Modeled with POLYSYS as highlighted in Chapter 5: Biomass from Agriculture.” In 2023 Billion‐Ton Report. M. H. Langholtz (Lead). Oak Ridge, TN: Oak Ridge National Laboratory. doi: 10.23720/BT2023/2350581.
The chapter relevant to this research can be cited as:
Hellwinckel, C., D. de la Torre Ugarte, J. L. Field, and M. Langholtz. 2024. “Chapter 5: Biomass from Agriculture.” In 2023 Billion‐Ton Report. M. H. Langholtz (Lead). Oak Ridge, TN: Oak Ridge National Laboratory. doi: 10.23720/BT2023/2316171.
Data from emerging resources, CO2 from chapter 7.3 in the 2023 Billion-Ton Report. Please access the data through the BT23 Data Portal or directly at https://bioenergykdf.ornl.gov/bt23-co2-high-purity-download and https://bioenergykdf.ornl.gov/bt23-co2-total-supply-download
Please cite as:
Coleman, A., K. Davis, J. DeAngelo, T. Saltiel, B. Saenz, L. Miller, K. Champion, E. Harrison, and A. Otwel. 2024, Data from Emerging Resources: CO2 of Chapter 7.3 in the 2023 Billion-Ton Report. Version 0.0.1, Bioenergy Knowledge Discovery Framework (KDF) Data Center, https://doi.org/10.23720/BT2023/2319081
Stationary sources of CO2 arise from a wide range of industrial and commercial activities, and their characteristics can vary between facilities in terms of CO2 purity, the type and percentage of any trace contaminants, and the temperature and pressure of emissions (EPA 2022a). Based on EPA’s Greenhouse Gas Reporting Program (GHGRP) data, it is estimated that 2,724 million tons of CO2 were emitted by stationary sources in 2022 (EPA 2022b). About 95% (2,584 million tons) comes from non-biogenic sources, and the remaining 5% (141 million tons) is from biogenic sources. This dataset provides High Purity data and Total Supply through the Download Tool
Videos
The U.S. Department of Energy Bioenergy Technology Office's (BETO's) 2023 Billion-Ton Report (BT23) is an assessment of renewable carbon resources potentially available in the United States. BT23 explores these resources in terms of quantity, price, geographical density and distribution, and market maturity. Resource quantities in this report are limited by specified economic and environmental sustainability constraints. Good practices are needed to ensure biomass production has positive environmental outcomes.
BT23 supports BETO's mission, particularly the 2023 Multi-Year Program Plan. To access 2023 Billion-Ton Report PDFs, appendices, and high-level messages, navigate to the 2023 Billion-Ton Report landing page at https://energy.gov/eere/bioenergy/2023-billion-ton-report-assessment-us… on the U.S. Department of Energy Bioenergy Technologies Office website.
To access information about the quality assumptions used in this report, please see the Biomass Feedstock Library at https://bioenergylibrary.inl.gov/Home/Home.aspx
Please cite the 2023 Billion-Ton Report as: U.S. Department of Energy. 2024. 2023 Billion‐Ton Report: An Assessment of U.S. Renewable Carbon Resources. M. H. Langholtz (Lead). Oak Ridge, TN: Oak Ridge National Laboratory. ORNL/SPR-2024/3103. doi: 10.23720/BT2023/2316165.
Featured Data Updates
a. Cotton gin trash and rice hulls, totaling 2.1 and 1.3 million tons per year in all scenarios, were omitted in error from the BT23 figures and initial data release. Data for these resources were added to the BT23 Agricultural Download on April 23rd, 2024. Methods are described in BT23 Appendix C, pages 6-7.
b. Orchard prunings, totaling 6 million tons per year in all scenarios, were classified as agricultural processing waste in the report, but are now classified as agricultural residues in the data. The combined changes from cotton gin trash, rice hulls, and orchard prunings cause agricultural residues to increase by 6 million tons per year and agricultural processing wastes to decrease by 2.5 million tons per year, as compared to values provided in Summary Table ES-1. This is less than a 1% change in the national results in all scenarios.
Constraints
Biomass resources in the 2023 Billion-Ton Report are presented as production capacity under specified environmental constraints, prices, and market scenarios. Modeling varies by resource class. For example:
- Agricultural residue production capacity is limited to about 1/3 of national total by retention constraints for soil conservation.
- Timberland resources are constrained such that total harvests are less than net growth, and sensitive areas are excluded.
- Energy crop production capacity is modeled as producer response to biomass markets in addition to projected demands for food, feed, fiber, and export. More detail is provided this summary document and in the report.
Errata
- Data for rice hulls and cotton gin trash are missing in the report, but have been added in the data portal (see data update information in “Featured Data Updates”)
- In Table 1.5 on page 15, the phrase “except where cable systems are in use (Northwest United States)” is an error. Cable harvesting systems were modeled for conventional timber products, but biomass from logging residues from cable harvesting systems were not included in the analysis. This assumption to exclude logging residues from cable harvesting systems can be questioned, because cable harvesting systems produce piles of logging residues at collection.
- In Figure ES-1 on page xix, labeling of microalgae and macroalgae in the top right of the figure are switched. The correct labeling should follow the symbology provided in the lower right of the figure, i.e. 169 million tons per year of microalgae at a weighted average price of $650 per ton, and 79 million tons per year of macroalgae at $500 per ton.
- In Figure ES-6 on page xxviii, under “Remaining timberland (unharvested)”, the "/year" was included in error. This is because remaining timberland is a stock, not an annual rate of production. However, the “/year” is correct for the “Harvest for conventional forest products” and “Reference scenario (small-diameter trees)” categories in the same figure.
- In Figure 5.11 on page 116, the primary and secondary y-axis scales are misaligned. The axes values should align with the horizontal lines.
- In the text box on page 23, “During CO2 fermentation some of this recycled CO2 can be harnessed…” should instead say “During fermentation some of this recycled CO2 can be harnessed…”
- A disclaimer was omitted in error. The disclaimer in the front matter of the 2016 Billion-Ton Report (https://energy.gov/eere/bioenergy/2016-billion-ton-report) is equally applicable to the 2023 Billion-Ton Report.
-
The following errors in v0.1 of waste data were corrected in v1.0:
-
The wet waste and solid waste price data released were erroneously inflated 14%, and has been reduced to 0 to report as 2022$. The wastes summary in Table 3.1 remains unchanged as $2022.
- A moisture content of 6% was assumed for waste paper, which was corrected to 5.5%, causing an increase of 447,000 dry tons of waste paper (i.e, 0.5% of waste paper).
-
Data from Emerging Resources: Macroalgae. Please access the data through the BT23 Data Portal or directly at https://bioenergykdf.ornl.gov/bt23-macro-algae-download
Please cite as:
A. Coleman. 2024, Data from Emerging Resources: Macroalgae of Chapter 7.2 in the 2023 Billion-Ton Report. Version 0.0.1, Bioenergy Knowledge Discovery Framework (KDF) Data Center, https://doi.org/10.23720/BT2023/2282995
This study represents the first U.S. full exclusive economic zone (EEZ) analysis for macroalgae biomass potential, inclusive of a marine area screening analysis, macroalgae biomass growth model, and associated TEA with harvest and farm gate biomass delivery.
Data from Emerging Resources: Microalgae
Please cite as:
A. Coleman, Davis, R., B. Klein. 2024, Data from Emerging Resources: Microalgae of Chapter 7.1 in the 2023 Billion-Ton Report. Version 0.0.1, Bioenergy Knowledge Discovery Framework (KDF) Data Center, https://doi.org/10.23720/BT2023/2282994
This data reflects the latest analysis from the 2022 Algae Harmonization Update, which uses the latest parameterized and high-performing saline algal strain, second-generation carbon capture of point-source waste CO2 and high-pressure pipeline transport resolved to specific point-source types, saline water sourcing up to 40,000 mg/L total dissolved solids for source and makeup water salinity, blowdown water treatment and recycle, and brine disposal handling.
Description:
Land-screening sites based on culmination of data through 2020 at a minimum contiguous area of 1,000 acres
Modeled biomass growth based on lab parameterizations of Tetraselmis striata LANL 1001 saline strain (DISCOVR program) using 40-years of hourly meteorology from NLDAS-2.
Microalgae growth model coupled with a pond temperature model at 10 acres per pond running at an operating salinity of 55,000 mg/L.
Cultivation productivity targets 26 g/m2-day annual average based on nutrient-replete, high-protein biomass composition at harvest.
Microalgae harvest set at a density of 0.5 g/L to maximize productivity.
Harvested microalgae sent through three-stage dewatering via gravity settling, membrane concentration, and centrifugation to 200 g/L.
Saline groundwater used as the exclusive source of water that is accessed at depths no greater than 500 m
Blowdown water disposal via forward osmosis brine concentration and well injection; clarified water from forward osmosis is recycled internally within the algae farm.
CO2 capture and transport uses 2020 viable point-sources and reported annual mass, with capture costs and energy demands varying by CO2 concentration in the point source; CO2 utilization efficiency of the microalgae is set at 75%
Urea and diammonium phosphate are used as nitrogen/phosphorus nutrients and are based on biomass productivity and composition
This dataset includes waster resources prepared for BT23 Chapter 3. Please access the data through the BT23 Data Portal or directly at https://bioenergykdf.ornl.gov/bt23-wastes-download
Please cite as:
Milbrandt, A., and A. Badgett. 2024, Data from Biomass from waste streams, of Chapter 3 in the 2023 Billion-Ton Report. Version 0.0.1, Bioenergy Knowledge Discovery Framework (bioenergyKDF)Data Center, https://doi.org/10.23720/BT2023/2282886