
market

This project contributes to understanding and enhancing socioeconomic and environmental benefits of biofuels through modeling the effect of prices and policy incentives on fuel markets for “hard-to-decarbonize” transportation sectors. The main analytical tool used in this project is the BioTrans model, originally developed to assess and quantify the economic and energy security benefits of biofuels for light-duty vehicles and bioproducts. This project restructured and updated the BioTrans model to assess biofuels for the hard-to-decarbonize transportation sectors such as the aviation and shipping.

The BioTrans model is a market equilibrium model assessing the biofuel supply chain for a 30-year horizon with annual periods. It is a national (United States) model and has states as its spatial units. The model maximizes social surplus, which implies minimizing the costs, while meeting transportation fuel demands. While it takes transportation fuel markets into account endogenously, land allocation decisions and non-biofuel uses of biomass are considered exogenously. The model considers potential synergies or competition for the use of biomass among the different transportation segments as well as the competition between new biofuels and incumbent petroleum-based fuels.

Diagram summarizes the main components included in BioTrans as of June 2024

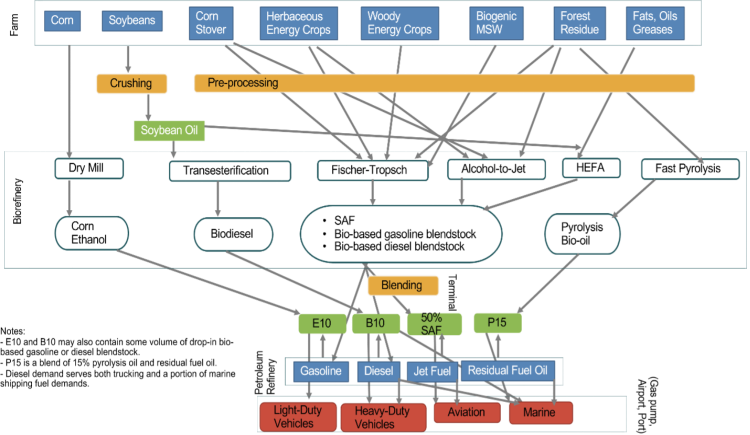
The diagram in Figure 1 summarizes the main components included in BioTrans as of June 2024.

The biomass feedstocks and petroleum products in blue rectangles are those for which the model includes supply curves, and the transportation segments in red boxes are those for which the model includes demand curves. The intermediate activities reflect the steps required to convert biomass into biofuel, and the intermediate products are biofuels required for blending and retail. Each commodity must satisfy a material balance equation so that its sources and sinks match with each other. 

The ability to explore the interaction of federal and state-level biofuel policies and their impact on the volume and mix of biofuels produced in the United States is one of the key attributes of the model. As of June 2024, BioTrans contains representations of the following biofuel-related policies and incentives:
Federal
-    Renewable Fuel Standard
-    Inflation Reduction Act (IRA) tax credits (Section 13201, Section 13202, Section 13203, Section 13704)
State
-    California Low Carbon Fuel Standard
-    Oregon Clean Fuel Program
-    SAF tax credits
-    Biodiesel and biomass-based diesel blending mandates

The code for the BioTrans model is available at https://code.ornl.gov/bioenergy/biotrans_model

Publication Date
Organization
Lab
Attachment
Author(s)
Rocio Uria Martinez , Jin Wook Ro
Create a DOI (from OSTI) for this document
On
OSTI DOI Released
DOI is only Reserved.

This report provides a status of the markets and technology development involved in growing a domestic bioenergy economy as it existed at the end of calendar year 2013. It compiles and integrates information to provide a snapshot of the current state and historical trends influencing the development of bioenergy markets. This information is intended for policy-makers as well as technology developers and investors tracking bioenergy developments. It also highlights some of the key energy and regulatory drivers of bioenergy markets.

Contact Phone
Associated Content in the KDF
Keywords
Publication Date
Project Title
Systems Analysis and Modeling
Contact Email
john.lewis@nrel.gov
Contact Person
John Lewis
Contact Organization
NREL
Bioenergy Category
Author(s)
U.S. Department of Energy
WBS Project Number
4.1.2.1
Funded from the U.S. Department of Energy, Office of Energy Efficiency and Renewable Energy, Bioenergy Technologies Office.

This paper introduces a spatial bioeconomic model for study of potential cellulosic biomass supply at regional scale. By modeling the profitability of alternative crop production practices, it captures the opportunity cost of replacing current crops by cellulosic biomass crops. The model draws upon biophysical crop input-output coefficients, price and cost data, and spatial transportation costs in the context of profit maximization theory. Yields are simulated using temperature, precipitation and soil quality data with various commercial crops and potential new cellulosic biomass crops. Three types of alternative crop management scenarios are simulated by varying crop rotation, fertilization and tillage. The cost of transporting biomass to a specific demand location is obtained using road distances and bulk shipping costs from geographic information systems. The spatial mathematical programming model predicts the supply of biomass and implied environmental consequences for a landscape managed by representative, profit maximizing farmers. The model was applied and validated for simulation of cellulosic biomass supply in a 9-county region of southern Michigan. Results for 74 cropping systems simulated across 39 sub-watersheds show that crop residues are the first types of biomass to be supplied. Corn stover and wheat straw supply start at $21/Mg and $27/Mg delivered prices. Perennial bioenergy crops become profitable to produce when the delivered biomass price reaches $46/Mg for switchgrass, $118/Mg for grass mixes and $154/Mg for Miscanthus giganteus. The predicted effect of the USDA Biomass Conversion Assistance Program is to sharply reduce the minimum biomass price at which miscanthus would become profitable to supply. Compared to conventional crop production practices in the area, the EPIC-simulated environmental outcomes with crop residue removal include increased greenhouse gas emissions and reduced water quality through increased nutrient loss. By contrast, perennial cellulosic biomass crops reduced greenhouse gas emissions and improved water quality compared to current commercial cropping systems.

Contact Email
aklesso@msu.edu
Data Source
AgEcono Search/Michigan State University
Contact Person
Egbendewe-Mondzozo, Aklesso
Author(s)
Egbendewe-Mondzozo, Aklesso

Ethanol use in the U.S. rose sharply in recent years due to public policy and a spike in petroleum prices, and remains high. Public support for ethanol includes mandated minimum levels of use nationwide. However, rather little is known about consumer demand for ethanol and much less about demand by type of blend and ethanol source. We used trial survey data and conjoint analysis to overcome the lack of historical data on consumers’ preferences for ethanol blend fuels. Preliminary findings based on responses from vehicle drivers in Missouri suggest that price is the primary factor behind fuel preferences. The disclosure of ethanol originated from woody feedstocks had a significant effect on preferences ceteris paribus. Ethanol blends of 20 percent had a negatively non-significant statistical effect compared to no-ethanol fuels or those with a 10 percent content. These findings will be tested using different models expanded to a nationwide pool of motor vehicle drivers.

Contact Email
aguilarf@missouri.edu
Data Source
AgEcon Search/Agricultural and Applied Economics Association
Contact Person
Aguilar, Francisco X.
Bioenergy Category
Author(s)
Aguilar, Francisco X.

This paper examines the possibilities of breaking into the cellulosic ethanol market in south Louisiana via strategic feedstock choices and the leveraging of the area’s competitive advantages. A small plant strategy is devised whereby the first-mover problem might be solved, and several scenarios are tested using Net Present Value analysis.

Contact Email
TMark@agcenter.lsu.edu
Data Source
AgEcon Search/Southern Agricultural Economics Association
Author(s)
Darby, Paul

In this study we use data envelopment analysis to decompose the overall economic efficiency of a sample of ethanol plants into three subcomponents: technical efficiency, allocative efficiency and a new component we call marketing efficiency. The relative importance of these sources of efficiency is of particular interest given the recent history of bankruptcies, plant closings and ownership change in the industry. Results reveal that observed production units are very efficient from a technical point of view as suggested by a standard deviation of 1% in technical efficiency. However, our results also show that bigger plants tend to be more economically efficient than others. The conventional methodology would have identified this difference as coming from allocative sources, i.e. bigger plants were correct in anticipating better relative prices and built more capacity accordingly. However introduction of a new concept we call marketing efficiency reveals that bigger production units obtain better relative prices (through marketing contracts) than smaller production units rather than anticipating prices more accurately. This might be a potential reason underlying the recent wave of mergers and acquisitions in the industry.

Contact Email
juampase@hotmail.com
Data Source
AgEcon Search/Agricultural and Applied Economics Association
Contact Person
Sesmero, Juan P.
Bioenergy Category
Author(s)
Sesmero, Juan P.

Events external to agriculture have set in motion the conditions for structural change in the marketing of corn in the U.S. These included a rapid increase in the price of crude oil from $40 per barrel to over $100 caused by hurricanes, geopolitical events, an increased global demand for energy from countries like China and India, and in December 2007, the U.S. raising the renewable fuel standards. The results of this research show that there could be significant changes in the historical utilization and marketing of corn in the U.S. The change in movement patterns provides one source of visible evidence that a structural change is underway.

Contact Email
dconley@unl.edu
Data Source
AgEcon Search/International Food and Agribusiness Management Review>Volume 11, Issue 3, 2008
Contact Person
Conley, Dennis M.
Author(s)
Conley, Dennis M.

The Federal Trade Commision performs a market concentration analysis of the ethanol production industry to determine whether there is sufficient competition among industry participants to avoid price-setting and other anticompetitive behaviour.The FTC must report its findings to Congress and to the
Administrator of the Environmental Protection Agency. This link presents the FTC’s
concentration analysis of ethanol production up to year 2009.

Keywords
Contact Email
mamunnis@ornl.gov
Bioenergy Category
Subscribe to market