transportation

This project contributes to understanding and enhancing socioeconomic and environmental benefits of biofuels through modeling the effect of prices and policy incentives on fuel markets for “hard-to-decarbonize” transportation sectors. The main analytical tool used in this project is the BioTrans model, originally developed to assess and quantify the economic and energy security benefits of biofuels for light-duty vehicles and bioproducts. This project restructured and updated the BioTrans model to assess biofuels for the hard-to-decarbonize transportation sectors such as the aviation and shipping.

The BioTrans model is a market equilibrium model assessing the biofuel supply chain for a 30-year horizon with annual periods. It is a national (United States) model and has states as its spatial units. The model maximizes social surplus, which implies minimizing the costs, while meeting transportation fuel demands. While it takes transportation fuel markets into account endogenously, land allocation decisions and non-biofuel uses of biomass are considered exogenously. The model considers potential synergies or competition for the use of biomass among the different transportation segments as well as the competition between new biofuels and incumbent petroleum-based fuels.
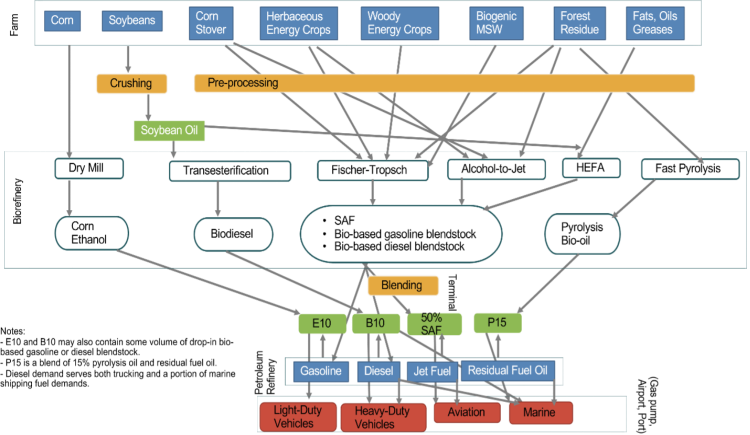
Diagram summarizes the main components included in BioTrans as of June 2024

The diagram in Figure 1 summarizes the main components included in BioTrans as of June 2024.

The biomass feedstocks and petroleum products in blue rectangles are those for which the model includes supply curves, and the transportation segments in red boxes are those for which the model includes demand curves. The intermediate activities reflect the steps required to convert biomass into biofuel, and the intermediate products are biofuels required for blending and retail. Each commodity must satisfy a material balance equation so that its sources and sinks match with each other. 

The ability to explore the interaction of federal and state-level biofuel policies and their impact on the volume and mix of biofuels produced in the United States is one of the key attributes of the model. As of June 2024, BioTrans contains representations of the following biofuel-related policies and incentives:
Federal
-    Renewable Fuel Standard
-    Inflation Reduction Act (IRA) tax credits (Section 13201, Section 13202, Section 13203, Section 13704)
State
-    California Low Carbon Fuel Standard
-    Oregon Clean Fuel Program
-    SAF tax credits
-    Biodiesel and biomass-based diesel blending mandates

The code for the BioTrans model is available at https://code.ornl.gov/bioenergy/biotrans_model

Publication Date
Organization
Lab
Attachment
Author(s)
Rocio Uria Martinez , Jin Wook Ro
Create a DOI (from OSTI) for this document
On
OSTI DOI Released
DOI is only Reserved.

The U.S. Department of Energy’s (DOE’s) Co-Optimization (Co-Optima) initiative is accelerating the introduction of affordable, scalable, and sustainable fuels and high-efficiency, low-emission engines with a first-of-its-kind effort to simultaneously tackle fuel and engine research and development (R&D).

Co-Optima is conducting research to identify the fuel properties and engine design characteristics needed to maximize vehicle performance and affordability, while deeply cutting harmful emissions. Rather than endorsing a single solution, this initiative is designed to arm industry, policymakers, and other key stakeholders with the scientific foundation and market intelligence required to make investment decisions, break down barriers to commercialization, and bring new high-performance fuels and advanced engine systems to market sooner.

DOE’s Office of Energy Efficiency & Renewable Energy has brought together nine national laboratories—the National Renewable Energy Laboratory and Argonne, Idaho, Lawrence Berkeley, Lawrence Livermore, Los Alamos, Oak Ridge, Pacific Northwest, and Sandia National Laboratories—to collaborate on this groundbreaking research. The outcome of this effort will be new tools, data, and knowledge to pave the way for future generations of fuel and vehicle innovations.

In its first year, the Co-Optima initiative moved from robust concept to concrete results. The two DOE offices, nine national laboratories, and industry stakeholders that compose Co-Optima successfully worked to integrate fuels and engine R&D, breakdown barriers, and tackle challenges. This report highlights the progress made by Co-Optima in fiscal year 2016.

In this inaugural year, our parallel Co-Optima research tracks have focused on fuels and engine technologies related to spark-ignition and advanced compression ignition systems.

Publication Date
Contact Email
john.farrell@nrel.gov
Contact Person
John Farrell
Contact Organization
National Renewable Energy Laboratory
Bioenergy Category
Author(s)
John Farrell , John Holladay , Robert Wagner
Funded from the U.S. Department of Energy, Office of Energy Efficiency and Renewable Energy, Bioenergy Technologies Office.

Understanding the environmental effects of alternative fuel production is critical to characterizing the sustainability of energy resources to inform policy and regulatory decisions. The magnitudes of these environmental effects vary according to the intensity and scale of fuel production along each step of the supply chain. We compare the spatial extent and temporal duration of ethanol and gasoline production processes and environmental effects based on a literature review and then synthesize the scale differences on space-time diagrams. Comprehensive assessment of any fuel-production system is a moving target, and our analysis shows that decisions regarding the selection of spatial and temporal boundaries of analysis have tremendous influences on the comparisons. Effects that strongly differentiate gasoline and ethanol-supply chains in terms of scale are associated with when and where energy resources are formed and how they are extracted. Although both gasoline and ethanol production may result in negative environmental effects, this study indicates that ethanol production traced through a supply chain may impact less area and result in more easily reversed effects of a shorter duration than gasoline production.

Publication Date
Bioenergy Category
Author(s)
Parish, Esther

ORNL Report ORNL/TM-2010-120.
The purpose of this study is to summarize the various barriers to more widespread distribution of biofuels through our common carrier fuel distribution system, which includes pipelines, barges and rail, fuel tankage, and distribution terminals, and with a special focus on biofuels, which may come into increased usage in the future. Addressing these barriers is necessary to allow the more widespread utilization and distribution of biofuels, in support of a renewable fuels standard and possible future low-carbon fuel standards. By identifying these barriers early, for fuels not currently in widespread use, they can be addressed in related research and development. These barriers can be classified into several categories, including operating practice, regulatory, technical, and acceptability barriers. Possible solutions to these issues are discussed, including compatibility evaluation, changes to biofuels, regulatory changes, and changes in the distribution system or distribution practices. No actual experimental research has been conducted in the writing of this report, but results are used to develop recommendations for future research and additional study as appropriate.

Contact Phone
Usage Policy
any
Publication Date
Contact Email
buntingbg@ornl.gov
Attachment
Data Source
Oak Ridge National Laboratory
Contact Person
Bruce Bunting
Contact Organization
Oak Ridge National Laboratory
Bioenergy Category
Author(s)
Bruce Bunting

This article addresses development of the Illinois ethanol industry through the period 2007-2022, responding to the ethanol production mandates of the Renewable Fuel Standard by the U.S. Environmental Protection Agency. The planning for corn-based and cellulosic ethanol production requires integrated decisions on transportation, plant location, and capacity. The objective is to minimize the total system costs for transportation and processing of biomass, transportation of ethanol from refineries to the blending terminals and demand destinations, capital investment in refineries, and by-product credits. A multi-year transshipment and facility location model is presented to determine the optimal size and time to build each plant in the system, the amount of raw material processed by individual plants, and the distribution of bioenergy crops and ethanol.

Contact Email
petersonsk@ornl.gov
Data Source
AgEcon Search/Farm Foundation
Contact Person
Tursun, Umit Deniz
Author(s)
Tursun, Umit Deniz

In January 1976, the Transportation Energy Conservation (TEC) Division of the Energy Research and Development Administration contracted with Oak Ridge National Laboratory (ORNL) to prepare a Transportation Energy Conservation Data Book to be used by TEC staff in their evaluation of current and proposed conservation strategies. The major purposes of the Data Book were to draw together, under one cover, transportation data from diverse sources, to resolve data conflicts and inconsistencies, and to produce a comprehensive document. The first edition of the TEC Data Book was published in October 1976. With the passage of the Department of Energy (DOE) Organization Act, the work being conducted by the former Transportation Energy Conservation Division fell under the purview of the DOE's Office of Transportation Programs.

Policymakers and analysts need to be well-informed about activity in the transportation sector. The organization and scope of the data book reflect the need for different kinds of information. For this reason, Edition 29 updates much of the same type of data that is found in previous editions.

In any attempt to compile a comprehensive set of statistics on transportation activity, numerous instances of inadequacies and inaccuracies in the basic data are encountered. Where such problems occur, estimates are developed by ORNL. To minimize the misuse of these statistics, an appendix (Appendix A) is included to document the estimation procedures. The attempt is to provide sufficient information for the conscientious user to evaluate the estimates and to form their own opinions as to their utility. Clearly, the accuracy of the estimates cannot exceed the accuracy of the primary data, an accuracy which in most instances is unknown. In cases where data accuracy is known or substantial errors are strongly suspected in the data, the reader is alerted. In all cases it should be recognized that the estimates are not precise.

The majority of the statistics contained in the data book are taken directly from published sources, although these data may be reformatted for presentation by ORNL. Consequently, neither ORNL nor DOE endorses the validity of these data.

Contact Email
DAVSSC@ornl.gov
Contact Person
Stacy C. Davis

A presentation by Bruce Heine of Magellan Midstream Partners to the 2006 Bioeconomy Conference held at Iowa State University.

Contact Phone
Contact Email
bruce.heine@magellanlp.com
Data Source
bioeconomyconference.org
Contact Person
Bruce Heine
Bioenergy Category
Author(s)
Bruce Heine

This article investigates ethanol and its integration into the petroleum supply chain. Recent state and federal mandates require varying levels of ethanol in reformulated gasoline (RFG) and, consequently, new complexities are being introduced into what has to this point been a streamlined petroleum supply chain. As managers and researchers work to respond effectively in this fast evolving situation, this explorative study employs a grounded theory approach (GTA) methodology and identifies five strategic priorities associated with achieving large-scale use of ethanol in RFG as a renewable energy source. The insights presented here regarding ethanol and its infusion into the petroleum supply chain provide a necessary first step in setting strategic priorities in this arena.

Contact Email
dmr28@psu.edu
Data Source
Transportation Journal
Contact Person
Dawn M. Russell
Bioenergy Category
Author(s)
Dawn M. Russell

The location of ethanol plants is determined by infrastructure, product and input markets, fiscal attributes of local communities, and state and federal incentives. This empirical
analysis uses probit regression along with spatial clustering methods to analyze investment activity of ethanol plants at the county level for the lower U.S. 48 states from 2000 to 2007.
The availability of feedstock dominates the site selection decision. Other factors, such as access to navigable rivers or railroads, product markets, producer credit and excise tax
exemptions, and methyl tertiary-butyl ether bans provided some counties with a comparative advantage in attracting ethanol plants.

Data Source
Journal of Agricultural and Applied Economics
Contact Person
D.M. Lambert
Author(s)
D.M. Lambert
Subscribe to transportation